

Mouse phenotype annotation
This section explains how statistically significant differences between mutant and control mice are translated into Mammalian Phenotype (MP) ontology annotations. It describes the process of mouse phenotype annotation, how statistical results are converted into phenotype calls in from statistics to phenotype, and how the direction of an observed effect is determined in determining the direction of phenotypic effects.
Mammalian phenotype ontology annotation
The statistical assessment determines whether mouse mutants exhibit a significant phenotypic difference from control (or wild-type) mice for each parameter measured. When the difference is significant, an ontology term is assigned to describe the phenotype. As the phenotype calls are made on a per-parameter basis, the results should be considered in the context of the procedure the parameter is part of.
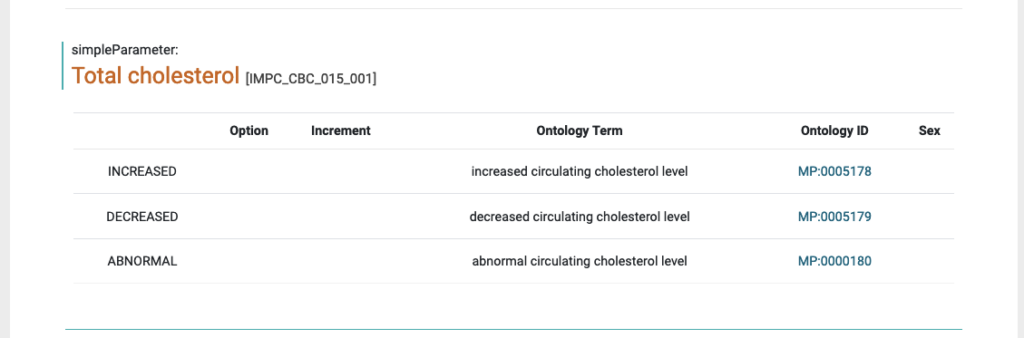
The particular Mammalian Phenotype (MP) Ontology terms that can be associated with a parameter are specified in IMPReSS. Often, an increase or a decrease of the parameter can be determined. However, in some cases, the direction cannot be determined and so the called phenotype only indicates a general abnormality.
From statistics to phenotype
If the mutant genotype effect represents a significant change from the control group at the IMPC level of 0.0001 for continuous and categorical measurements, then the IMPC pipeline will attempt to associate a Mammalian Phenotype (MP) term to the data (Mammalian Phenotype Ontology).
The particular MP term(s) defined for a parameter are maintained in IMPReSS. Frequently, the term indicates an increase or decrease of the parameter measured, as compared to controls. If this is not appropriate, then an abnormal call may be indicated.
When a statistical result is determined as significant, the following diagram is used for associating MP terms:
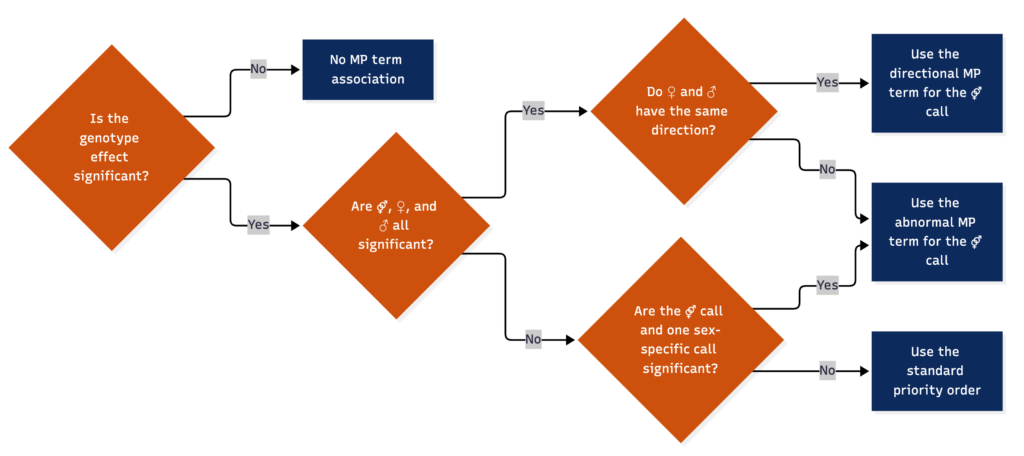
Decision diagram for assigning Mammalian Phenotype (MP) terms from genotype-effect results.
Legend: ♀ denotes the female-specific mutant-versus-control result; ♂ denotes the male-specific result; and ⚥ denotes the combined-sex result, using males and females together. These symbols identify the analysis, not the sex of an individual mouse. Orange diamonds are decision points; blue boxes are annotation outcomes; arrows labelled Yes or No indicate which branch to follow. A “call” is a phenotype annotation for the indicated sex group. “Same direction” means that the female and male estimates both indicate an increase or both indicate a decrease relative to controls. A directional MP term specifies increased or decreased; an abnormal MP term does not specify a direction.
Determining the direction of phenotypic effects
To identify the direction of the effect, a statistical metric called the “estimate” is used. This is the model coefficient from the final adjusted model, adjusted for the fixed effects, random effects, and weight structure that were retained in the final model. In other words, the estimate accounts for soft windowing, body weight (if included as a covariate), and the underlying data structure.
If the estimate > 0, the assigned MP term is “increased”. If the estimate < 0, the assigned term is “decreased”.
In rare cases, it may appear that an incorrect MP term has been assigned to the observed outcome on the chart, for example, “increased” where “decreased” would be expected, or vice versa. This can occur because the chart does not account for whether body weight was used as a covariate, or for the complexity of the model used to derive the estimate.
The summary statistics table contains means and standard deviations calculated across the whole dataset, including data outside the soft window, which may also give the appearance of an incorrect MP term being assigned.