
Disease Models
The genetic cause underlying many human heritable diseases are still not identified. Model organisms with targeted modifications of the genome can help identifying the genetic causes for human diseases. Currently, there is a vast amount of gene-phenotype data across clinical resources, for model organisms with targeted modifications and non-model organisms. Combining and harmonizing these data, scattered across different databases, allows an integrated view of all the existing resources and helps identifying the genetic causes underlying a disease. Genetic diseases and the resulting animal model match are ranked by their phenotypic similarity to the disorder, thus constituting a prioritising resource.
Human Disease Section
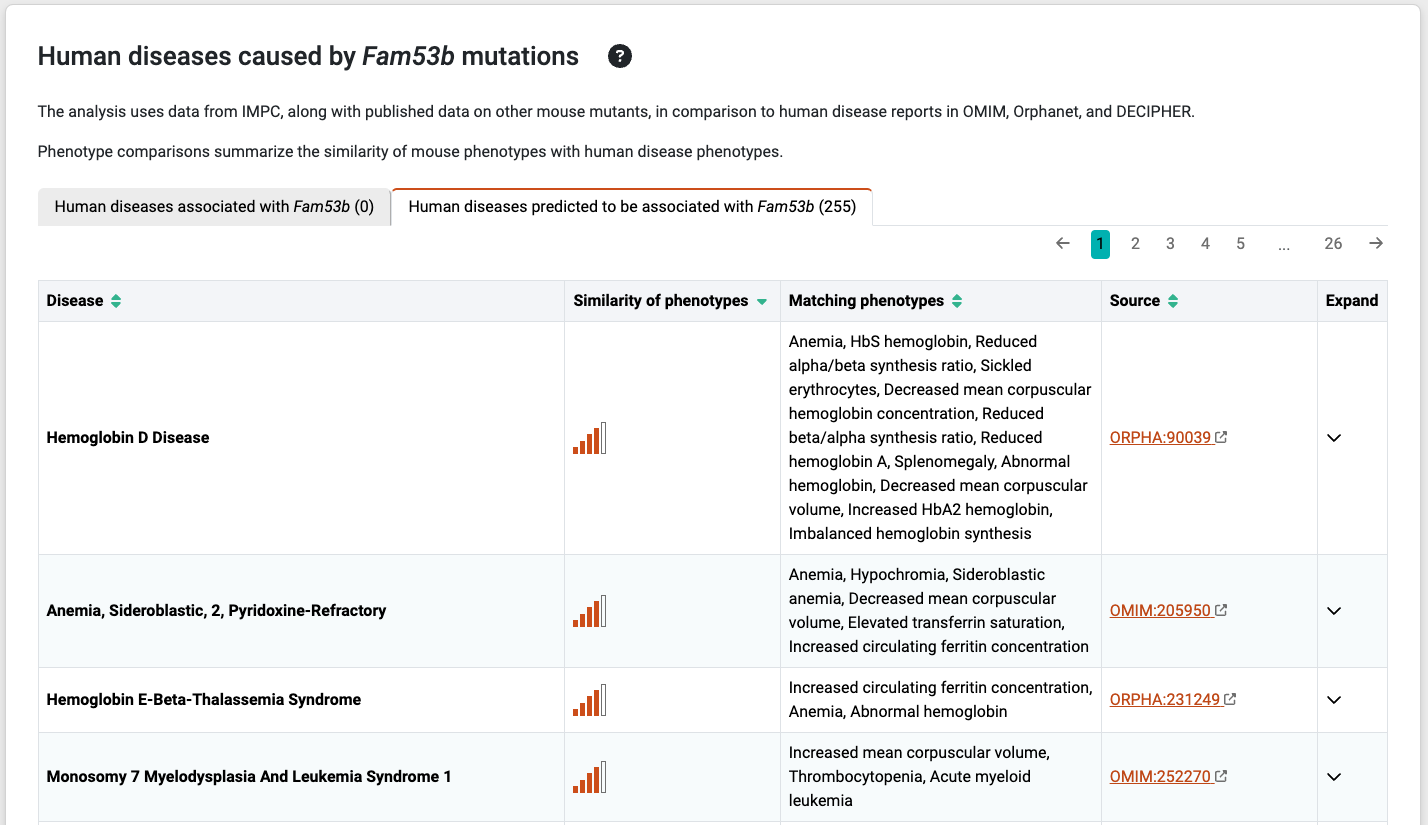
The human disease section table contains the following information for the gene of interest:
- Disease: name of associated disease
- Similarity of phenotypes: Phenodigm score [0-100] between human disease phenotypes and matched mouse model phenotypes for the gene of interest.
- Matching phenotypes: human disease phenotypes that were matched by the mouse model phenotypes for the gene of interest.
- Source: disease identifier and hyperlink to disease information
- Expand: Phenogrid visualization.
Phenodigm scores
Phenodigm scores (Smedley et al. 2013) reflect the similarity between phenotype profiles, in this case the clinical descriptions of human diseases, as featured in OMIM, Orphanet and DECIPHER, described using the Human Phenotype Ontology (Köhler et al. 2017; HP terms), and mouse phenotypes mapped to the Mammalian Phenotype Ontology (MP terms). The raw score is normalized against the maximal possible score, which is the query matching to itself, so that the resulting score ranges between 0 and 100.
Please see our Disease associations section to learn how these associations are performed.
Interpretation of Phenodigm Scores
Phenodigm scores measure how well the phenotypes of a mouse model replicate those of a human disease.
A high score indicates that many disease phenotypes are captured by the model, whereas a low score suggests that several disease phenotypes are not observed in the mouse.
As a general guide:
The mean Phenodigm score for DR24 is 31.70
- Scores above 40 can be considered high.
- Scores close to 100 should be inspected carefully.
- Scores below 30 still provide useful insights, depending on context.
Several factors influence how to interpret Phenodigm scores. Below are general guidelines and examples to help users understand what different scores may indicate.
General Guidelines
- Review both the Phenodigm Score represented in the “Similarity of phenotypes” column and the “Matching Phenotypes” column that shows the matched disease phenotypes.
- Compare the Matching Phenotypes with the full set of human disease phenotypes. The Phenogrid tool can assist in visualizing and assessing these matches.
- Regardless of the score, evaluate the quality and relevance of the matched phenotypes.
The usefulness of a phenotypic match depends on the user’s research goals:
- Finding a model that captures a specific, high-priority phenotype of interest, even if not all disease phenotypes are represented.
- Identifying a model that recapitulates a broad range of disease phenotypes.
Interpreting very high scores (above 90)
- If the Phenodigm score exceeds 90 but only 1–2 phenotypes are matched, the corresponding human disease may have only a few annotated phenotypes.
In such cases, assess whether those matched phenotypes accurately represent the key features of the disease. - If the number of matched phenotypes is higher (e.g., 5+), the model likely recapitulates most of the disease’s annotated phenotypes.
- However, a very high score does not always mean high relevance—check whether the matched phenotypes reflect the critical or characteristic features of the disease that are relevant to your research.
Interpreting low scores (below 30)
- If the Phenodigm score is below 30 but the number of matched phenotypes is high, this may indicate that the human disease has many annotated phenotypes.
These matches can still be useful for identifying candidate models that capture specific disease features. - If both the score and the number of matched phenotypes are low (e.g., 1–2), this usually reflects a poor phenotypic match.
Even for low-scoring models, a few strong and biologically relevant matches may still make the model valuable—particularly if those phenotypes align closely with the user’s research priorities. For a thorough explanation of the interpretation of the scores and some examples check our publication and webinar.
The Phenogrid widget
The Phenogrid widget is displayed when you click on the arrow sign under the Expand column associated with the disease, and it is developed by Monarch Initiaitve.
The Phenogrid widget allows visualization of the similarity results between:
- A set of phenotypes in a query (rows; in this case, phenotype annotations to a human disease)
- One or more phenotypically similar targets (in this case, phenotypes annotations to a mouse gene)
When a phenotype is shared between the query and the target, the intersection is colored and the saturation of the cell correlates with the strength of the match. You can hover over the intersection to find the phenotype of the target and the query, as well as what is common between the two.
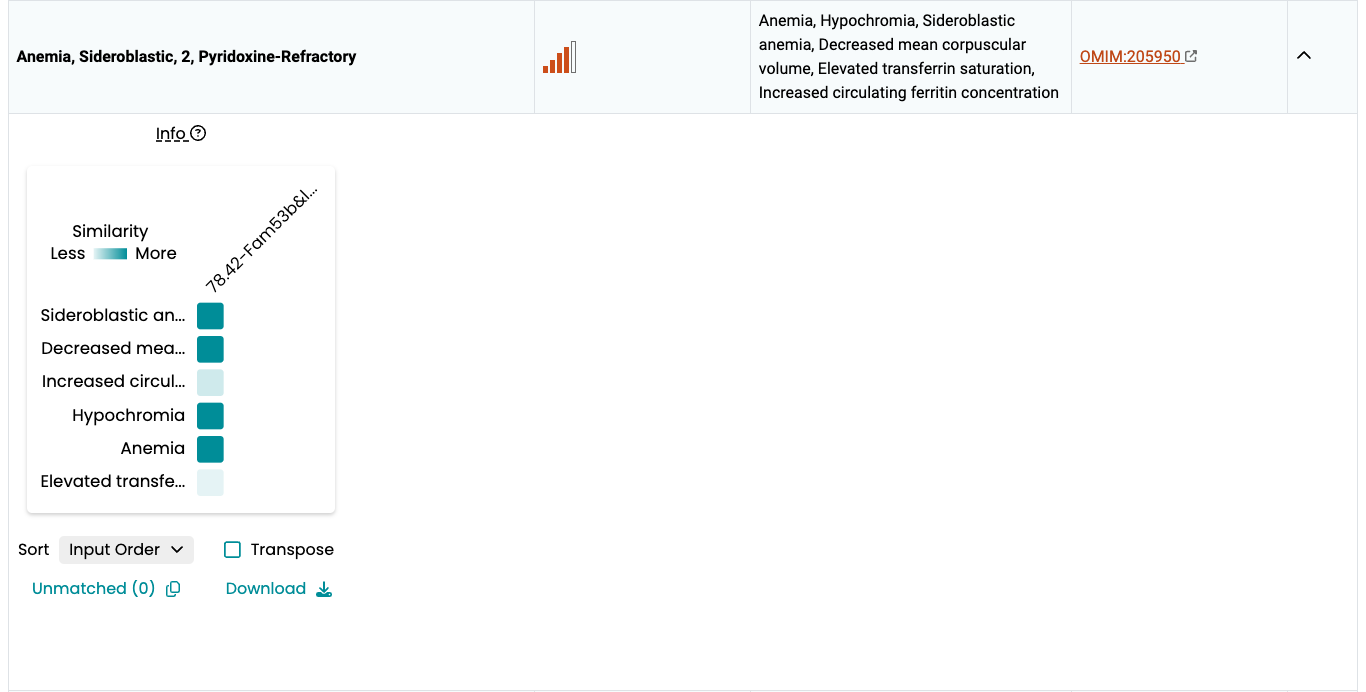
The Phenodigm score between a disease and a mouse model is presented in the labels as “Score – MGI Accession ID”. To see further details hover over the labels to view the tooltip.
Associations are performed in two ways
The Phenodigm algorithm described here enables the computation of phenotypic similarities between a mutant mouse and a Mendelian disease. For each gene, the overlap between the abnormal phenotypes observed in the mouse and those reported in humans is categorised into two groups:
- Human diseases known to be associated with the corresponding human orthologue. This category helps evaluate how well the mouse knockout mimics, even if partially, the phenotypes described in humans. It compares the IMPC model to previously existing models documented by MGI and can reveal new models for known human disease–gene associations.
- Human diseases predicted to be associated with the corresponding human orthologue. This category shows the phenotypic similarities to human diseases where no gene-disease association has been established. It facilitates the exploration of potential novel gene-disease links.
This information is presented on the gene pages for each gene individually and can also be explored systematically for all IMPC genes via the disease models application: https://diseasemodels.research.its.qmul.ac.uk/
More on the Phenogrid widget and the matching algorithm
- Sort. Sort labels using Alpha. (a → z) or (z → a) to sort by disease-model Phenodigm score. Warning: using the Score dropdown options will not sort by Phenodigm score but by the sum of the Ancestor IC score.
- Transpose. Swap rows and columns.
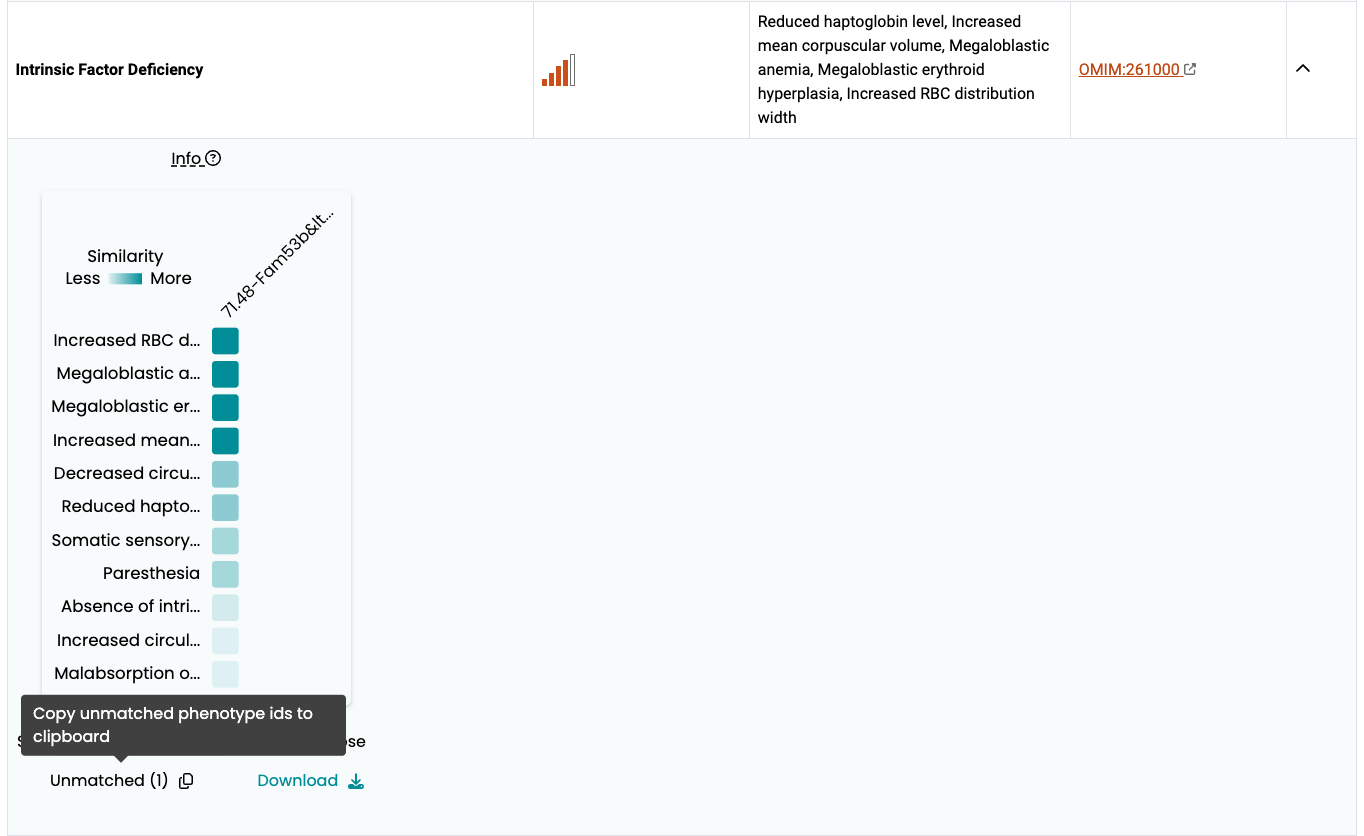
- Unmatched. Phenotypes that were part of the query but are not shared by any of the targets can be viewed by clicking the Unmatched link.
- Download. Download an image of the Phenogrid in SVG format.
- Two targets that share the same phenotypes may have a different overall score. This happens when there are phenotypes in the target that are not shared with the query. A target that matches the query for all phenotypes will rank higher than a target that matches all of them but also has one or more additional phenotypes that don’t match it; that is, the target is penalized for those phenotypes that are not shared and thus ranks lower on the similarity scale.
Learn more:
Check out our Disease associations section
Visit the Monarch Initiative website