Phenotypes section
The Phenotypes section has three tabs. Each tab provides different views of the data, emphasising different aspects, so users can quickly find what they are looking for.
- Significant phenotypes table
- All data table
- Graphical Analysis display chart
Significant phenotypes table
The significant phenotypes table shows significant genotype-phenotype effects as identified by the IMPC applying dedicated phenotyping tests and statistical procedures. Phenotypes in the mutant mice that differ from those of the controls are annotated using a Mammalian Phenotype (MP) Ontology term, e.g. MP:0001513 – limb grasping, an ontology designed to describe abnormalities in mouse strains.
By clicking on the link of each row, the chart page is displayed.
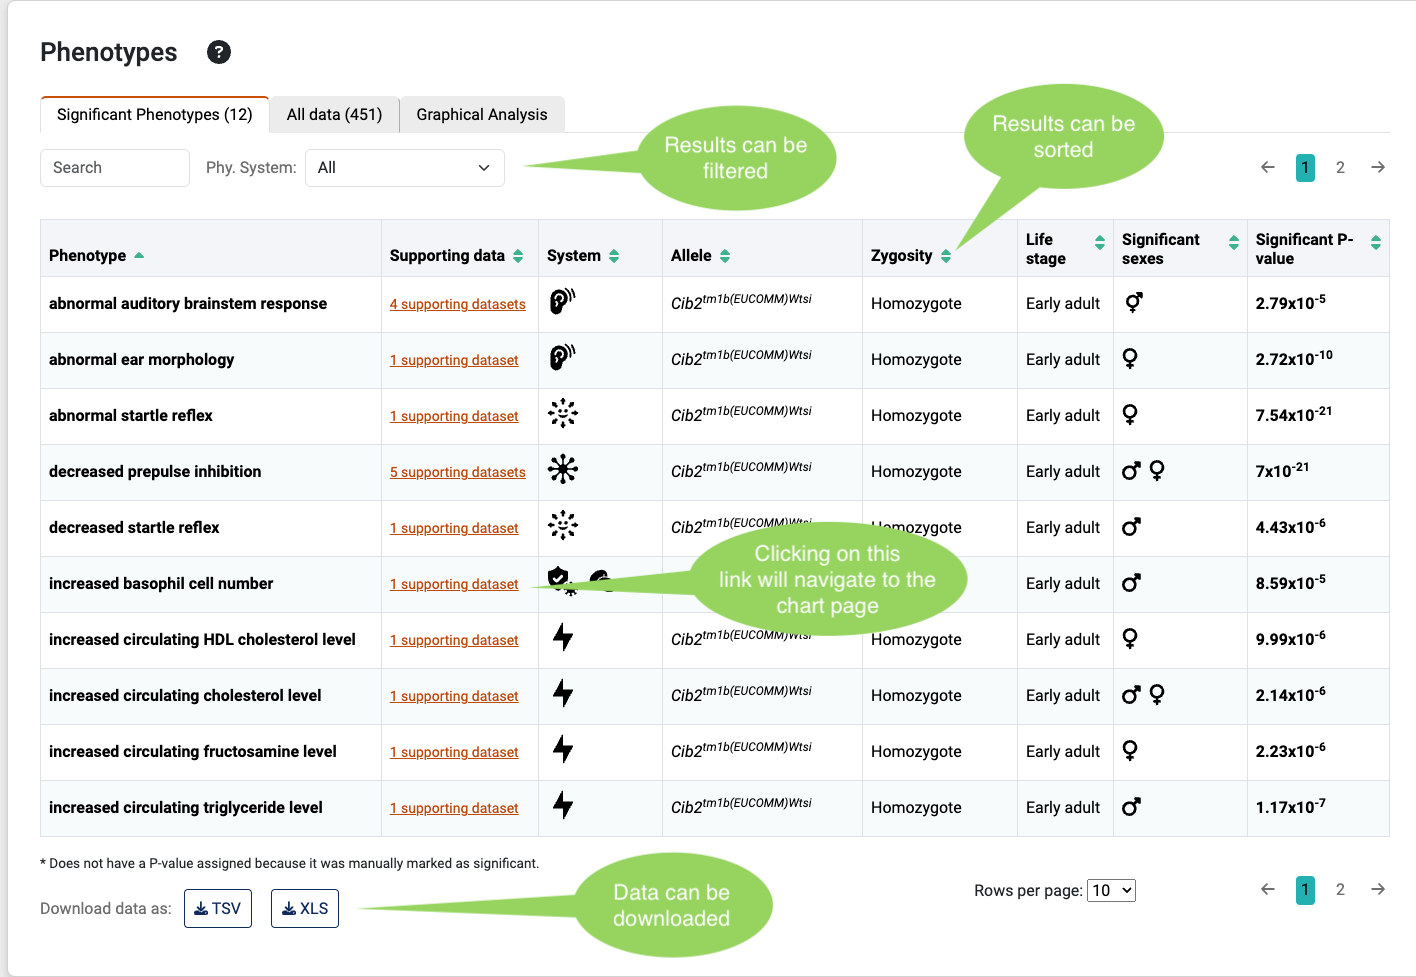

Note that multiple parameters can be associated with the same phenotype, or more than one mouse strain may have been phenotyped. Thus, when multiple associations are established with one phenotype, only the most significant association (P value) is shown in this table.
All data table
The All data table displays all data available for all knockout mouse lines associated with a gene.

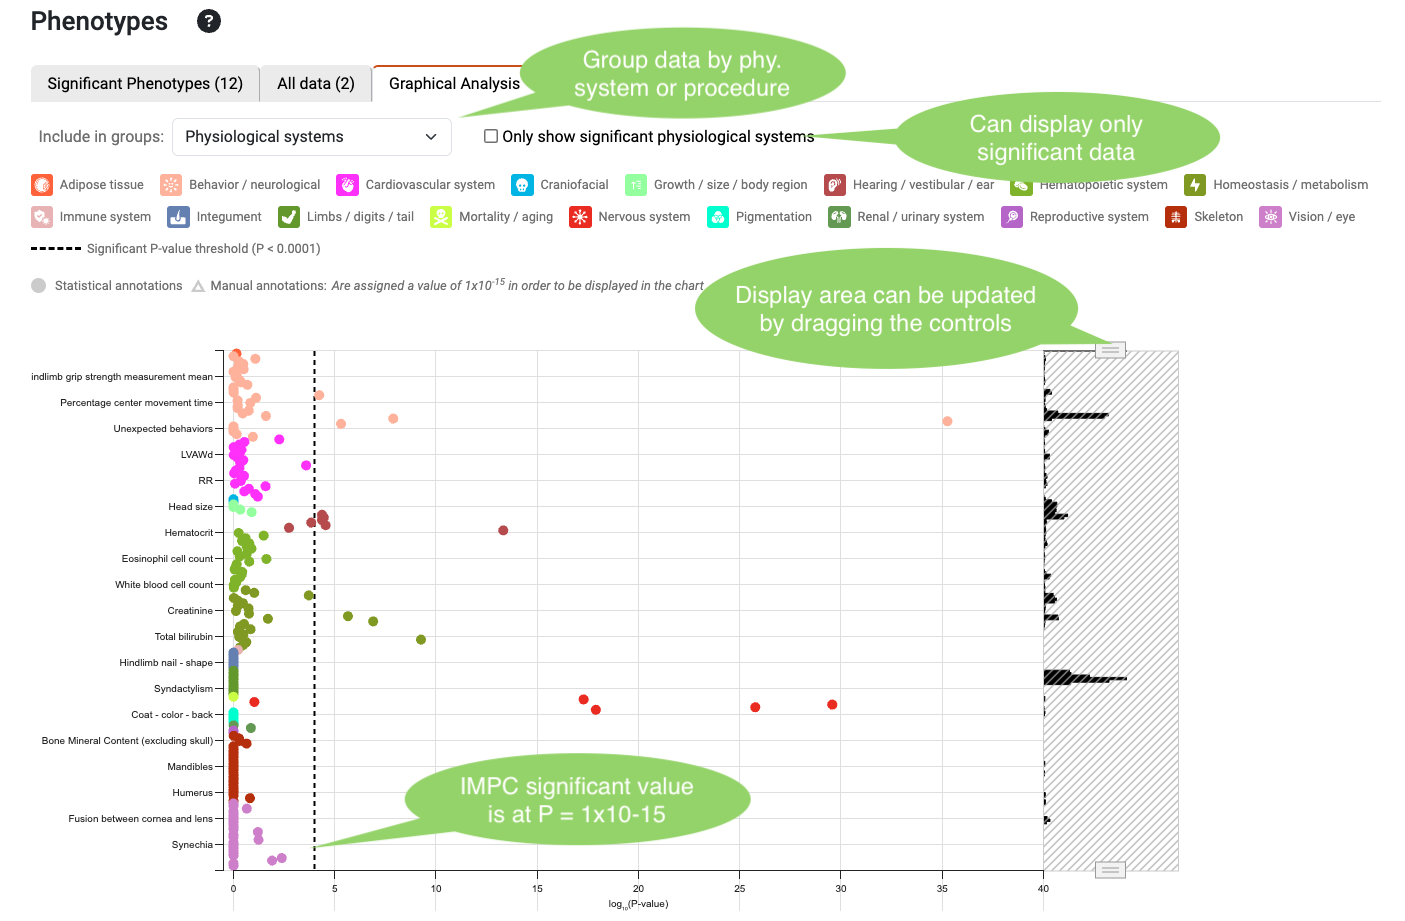
Graphical Analysis chart
Here the most significant result for each parameter is displayed. Results can be grouped by physiological system or procedure. The data also can be filtered by significance. Hovering over the points shows measurement-related information. The controls on the right enable a more precise selection on the data displayed.
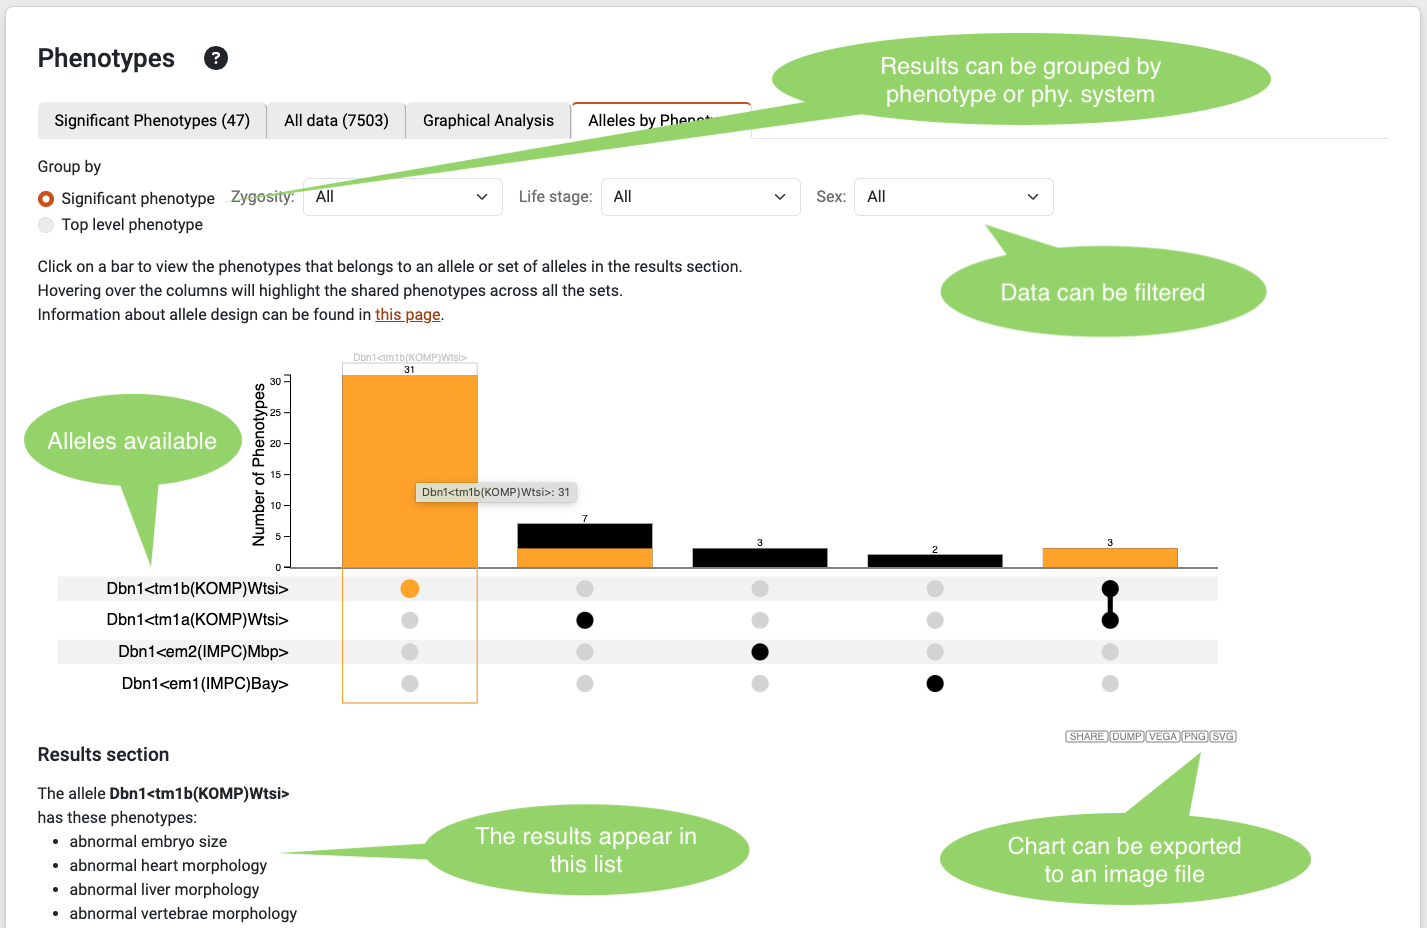
Phenotype Allele diagram
For the genes with more than one allele, the website will show this additional chart. This chart will help users interested in knowing the differences between the alleles of a gene and their respective significant phenotypes. By clicking each bar, the list of significant phenotypes will appear on the bottom, this section will also contain a description of the allele or alleles selected. The data can be filtered by zygosity, life stage and sex for complex comparisons.